Releases
WADA publishes data from Phase II of ADO Benchmarking Project

Today, the World Anti-Doping Agency (WADA) is pleased to publish the data from Phase II of the Anti-Doping Organization (ADO) Benchmarking Project, which aims to help International Federations (IFs) measure their activity in context. This follows the publication of Phase I in June of 2024, which focused on National Anti-Doping Organizations (NADOs)1.
Background
The Benchmarking Project was created to establish typical ranges of activity for similar ADOs so they can understand their own levels of activity across various program indicators (i.e., number of tests, Registered Testing Pool (RTP) size, budget, etc.) within the context of those ranges. This will enable ADOs to identify possible gaps in program delivery and address underlying issues accordingly.
Grouping
The World Anti-Doping Code Signatory Tiers (as defined in the Prioritization Policy2) have been split into smaller groups based on three complementary factors:
-
Sport risk (measured by Minimum Levels of Analysis (MLAs) defined in the Technical Document for Sport-Specific Analysis (TDSSA));
-
Sport type, as defined by the Strategic Testing Expert Advisory Group (e.g., cardiovascular endurance, power & strength, combat sports, etc.);
-
Worldwide size of the sport, measured by the number of tests conducted by NADOs in the sport.
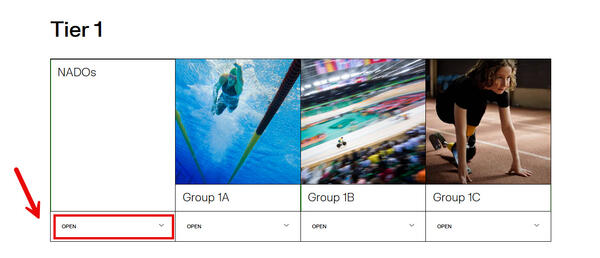
While these factors are external to the IF, they largely determine the context within which it operates. Tier 1 is split into three groups, while Tiers 2, 3, and 4 are split into two groups each. It is important to note that there is no hierarchy between the groups.
Data Visualizations
The initial indicators are as follows:
Taken from ADAMS:
-
2024 tests (total);
-
RTP size at the end of 2024; and
-
Therapeutic Use Exemptions (TUEs) processed in 2024.
Taken from the Code Compliance Questionnaire (CCQ) or Audits, or as otherwise shared with WADA by the ADO:
-
Budget (USD); and
-
Full-time staff.
Kindly note that the purpose of the data visualizations is to inform not evaluate: an IF can fall outside typical ranges for any given indicator without this representing a program delivery issue. The hope is that this information will be useful to IFs, allowing them to benchmark themselves against their peers, reflect, and improve their programs as they see fit.
Use Cases
As mentioned above, the aim of these visualizations is not to evaluate ADOs, but to provide them with contextual information within which to understand their own data and their own programs. By grouping IFs together with those that share the most similar work, we are able to provide ranges for program activity indicators as well as resources, enabling ADOs to evaluate for themselves whether their current levels are optimal for them. Questions that might arise when looking at these visualizations could include:
- Is our level of testing appropriate given where we sit within the group? Are there good reasons for us to be above/below the average?
- Is our RTP sufficiently large to cover the highest-risk athletes within our jurisdiction?
- Are our resources (financial and human) a constraint on our ability to conduct anti-doping activities at a similar level to comparable ADOs?
Accessing the data
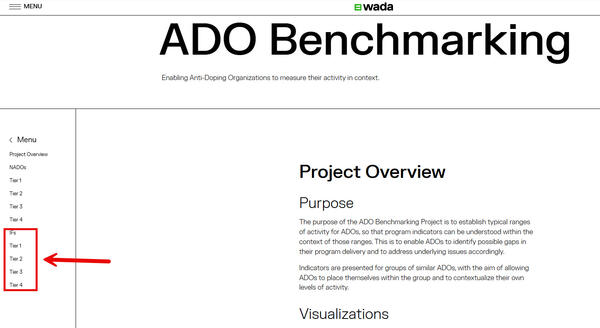
The data section of the ADO Benchmarking webpage is organized by Tier—each Tier has an “IFs” tab that lists the IF members for each group. Once an IF identifies their group, they can open the corresponding tab to see the data.


Should IFs have any feedback or questions regarding the data presented or the ADO Benchmarking Project more broadly, we invite you to contact the Sport Movement Relations team at sportrelations@wada-ama.org.
Notes:
(1) As of today, the NADO data has been updated to correspond to 2024 figures.
(2) WADA’s Policy for the Application of the International Standard for Code Compliance by Signatories (ISCCS), also known as the Prioritization Policy, divides Signatories into different Tiers, which consider sporting performance and doping risk (based on sport and discipline).

